
Monitoring & uptime
Latensy
High-signal uptime and performance monitoring for websites, APIs, cron jobs, and feeds
- 0community votes
- 7DR by Ahrefs +2 (up) since last check
Ahrefs Domain Rating listed 6 Nov 2026, relisted 27 Oct 2026.
Uptime and performance monitoring tool that confirms incidents through consecutive failures, tracks degradation and latency, and provides reports for
What it is
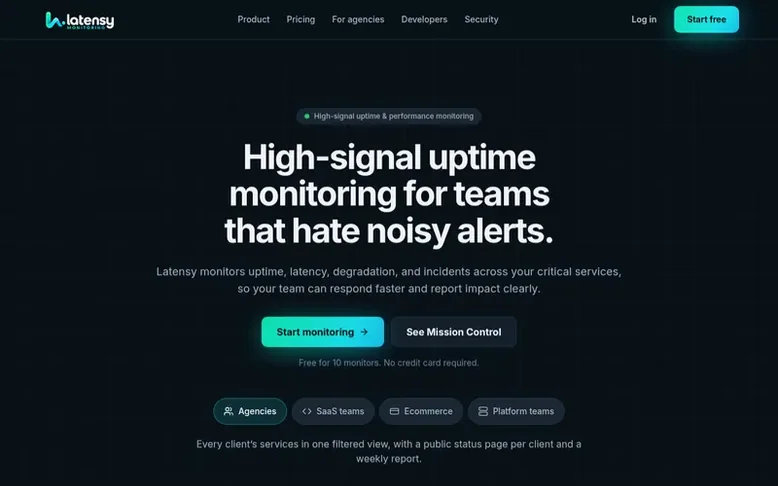
Latensy: the homepage
Latensy is a monitoring platform for teams managing multiple services who need reliable incident detection and stakeholder communication. It monitors websites, APIs, cron jobs, feeds, certificates, domains, and internal tools, confirming incidents only when they are real through configurable consecutive-failure rules rather than alerting on single transient failures. The platform tracks both uptime and latency, distinguishing between down services and degraded performance, and routes alerts to email, Slack, and webhooks only when incidents are confirmed. Teams can organize services by client, environment, owner, and business impact, and generate reports including Executive Summary, Impact Report, and revenue-at-risk estimates to communicate outages to clients and leadership.
Listed capabilities
- Consecutive-failure incident confirmation rules
- Latency and degradation tracking with P95 and at-risk detection
- Public status pages with 24-hour history
- Executive Summary and Impact Report
- Service tagging by client, environment, owner, and criticality
- CSV and JSON data export
- Maintenance windows to suppress alerts for planned work
- Team roles and access control
Pricing
Pricing model: Freemium
Free: 10 monitors, 5-minute checks, 30 days of history, email alerts, 1 status page. Growth: $29/month (or $278/year), 50 monitors, 10 priority monitors checked every minute, 90 days of history, Slack and webhook alerts, Executive Summary. Business: $99/month (or $940/year), 200 monitors, 25 priorit
Follow Latensy for an email about each milestone, update and new product they post, in a daily summary.
Latensy metrics
| Metric | Value |
|---|---|
| Domain Rating | 7 +2 (up) since last check |
| Trust Flow | 5 no change since last check |
| Citation Flow | 18 no change since last check |
| Referring domains | 6 no change since last check |
| External backlinks | 31 no change since last check |
Ahrefs Domain Rating listed 6 Nov 2026, relisted 27 Oct 2026. Listed under topic: Computers/Software/Operating Systems (5). Majestic listed 25 Oct 2026, relisted 25 Oct 2026. Link data listed by Majestic. Trust Flow, Citation Flow and Topical Trust Flow are trademarks of Majestic-12 Ltd.
Latensy domain listing data
Show the listing data
| Domain age | 9 months |
|---|---|
| Registered | |
| Expires | |
| Registrar | NameSilo, LLC |
| DNSSEC | Not signed |
Latensy launch receipt entry
| Measure | At launch, then latest |
|---|---|
| Domain Rating (Ahrefs) | 4 to 7 +3 (up) since launch 25 Oct 2026, then 6 Nov 2026 |
| Trust Flow (Majestic) | 5 first measured 25 Oct 2026 |
| Referring domains (Majestic) | 6 first measured 25 Oct 2026 |
Day 11 since launch. Next receipt: day 30, 24 Nov 2026. We show what changed, not what caused it: many things affect these numbers. Nothing here is estimated.
Before you launch
The playbook on SaaS Directory List lists what to prepare, what to post on launch day and where else to list your product.
Compare and explore
Quick answers
Which services can Latensy monitor?
Latensy monitors websites and HTTP(S) endpoints, keyword presence, SSL certificates, DNS records, TCP ports, ping, domain expiration, cron jobs via heartbeat, authenticated REST APIs, GraphQL, WebSocket endpoints, and database reachability.
How does Latensy reduce noisy alerts?
Incidents are confirmed by consecutive failures you configure per service, not a single failed request. Slow responses are tracked as degraded rather than down. Maintenance windows suppress alerts for planned work, and tags and criticality rank what deserves attention first.
Does Latensy replace observability platforms like Datadog, New Relic, or Grafana?
No. Deep observability is for debugging, while Latensy is the focused service-health layer showing what is down, degraded, at risk, and what to tell stakeholders. Many teams run it alongside their observability stack.
Where is my data hosted?
Latensy runs on infrastructure in Germany (EU). Checks are performed from there, and monitoring data stays there. Payments are processed by Stripe.
Do I need a credit card for the Free plan?
No. You can sign up, add up to 10 monitors, and connect an email alert channel without providing a credit card. Upgrade only when you need more monitors, faster checks, more alert channels, or reporting.
Leave a review for Latensy
No reviews listed for Latensy yet. List the first one.
Listing a review is free. No one pays for reviews. See the listed reviews
List reviews · List updates · Share the list · Your tool? Claim this list entry · Report this list entry
Latensy has a free listing. The owner can unlock the full profile with a paid launch for $5:
- Founder story (locked)
- Milestones (locked)
- Demo video (locked)
- Dofollow website link (locked)
Also on the list
-
DR 6 +3 (up) since last check 0 votes. Log in to move PageRadar up the list
-
DR 10 no change since last check 0 votes. Log in to move ShadowHare up the list
-
 Number 3: StackFirefly
WordPress reliability monitoring that detects silent failures beyond uptime
DR 0 no change since last check 0 votes. Log in to move StackFirefly up the list -
DR 0 no change since last check 0 votes. Log in to move RivalPeek.io up the list